
Effective Date: 15 June 98
toc - Fuel flow will be measured and evaluated both as a volumetric flow and as a mass flow. Traditionally fuel flow is normalized in the form:
However, it is possible that a Theta exponent other than 0.5 may be applicable on the high bypass. If this is the case, test data will verify the final exponent.
Mass Fuel Flow
Fuel flow will be measured and evaluated using a mass-type fuel flow meter which measures the change in angular momentum of the fuel passing through the meter and is independent of the fuel density (temperature).
A comparison will be made between the fuel flow calculated by the mass and the volumetric system. However, the volumetric flow rate will be considered primary because past experience indicates better accuracy and repeatibility with volumetric rate measurement.
Volumetric Fuel Flow
Ideally, the mass fuel flow is calculated from the measured volumetric flow as follows:
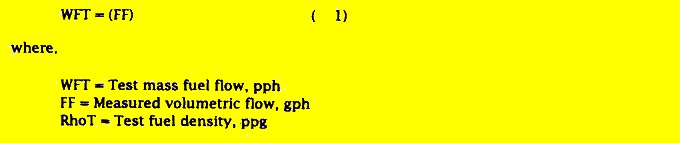
Since fuel density (Rho) cannot be measured in flight for each test point, the test point fuel temperature, the preflight density and temperature, and a knowledge of the change in density per change in temperature can be used to calculate the test fuel density as follows:
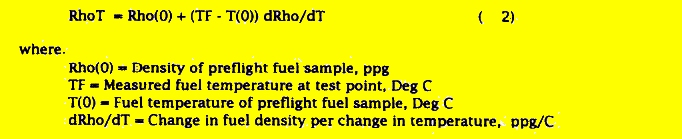
However, it is more convenient to correct the preflight sample data to 15.5 Deg C (60 Deg F) because the hydrometers are calibrated at 15.5 Deg C (60 Deg F). Combining equations (1) and (2), and subscripting for data corrected to 15.5 Deg C,

Equation (3) is used to calculate the mass fuel flow from the measured volumetric data. The density (Rho15.5) is obtained by converting the preflight sample specific gravity reading to the equivalent density at 15.5 Deg C., (See section on DERIVATIONs). The change in density per change in temperature (dRho/dT) is obtained from a curve similar to that shown in Figure 1, which is based on previous laboratory analysis of fuel samples. This is discussed in more detail in the section on DERIVATIONs.
Fuel Flow Evaluation
Using fuel flow data obtained during testing, the following set of generalized plots will be evaluated for bleed off:
A typical correction factor plot is shown; however, analysis of the data may indicate that the correction factors are not required.